Corynorhinus townsendii (Townsend's Big-eared Bat)
Visual overview of genome assembly metrics
K-mer spectra output generated from PacBio HiFi data without adapters using GenomeScope2.0.
BlobToolKit Snail plot representing quality metrics for the primary Corynorhinus townsendii assembly (mCorTow1). The plot circle represents the full length of the assembly. The central red arc and corresponding line indicate the length of the longest scaffold. All other scaffold lengths are shown in dark gray ordered from largest to smallest moving clockwise with lengths indicated by the vertical axis located at 12 o’clock. The central light gray circle shows the cumulative scaffold count using log10 scale. The dark and light orange arcs indicate the scaffold N50 and scaffold N90 values, respectively. The dark to light blue ratios around the outside of the circle represent the proportion of AT to GC content at 0.1% length intervals.
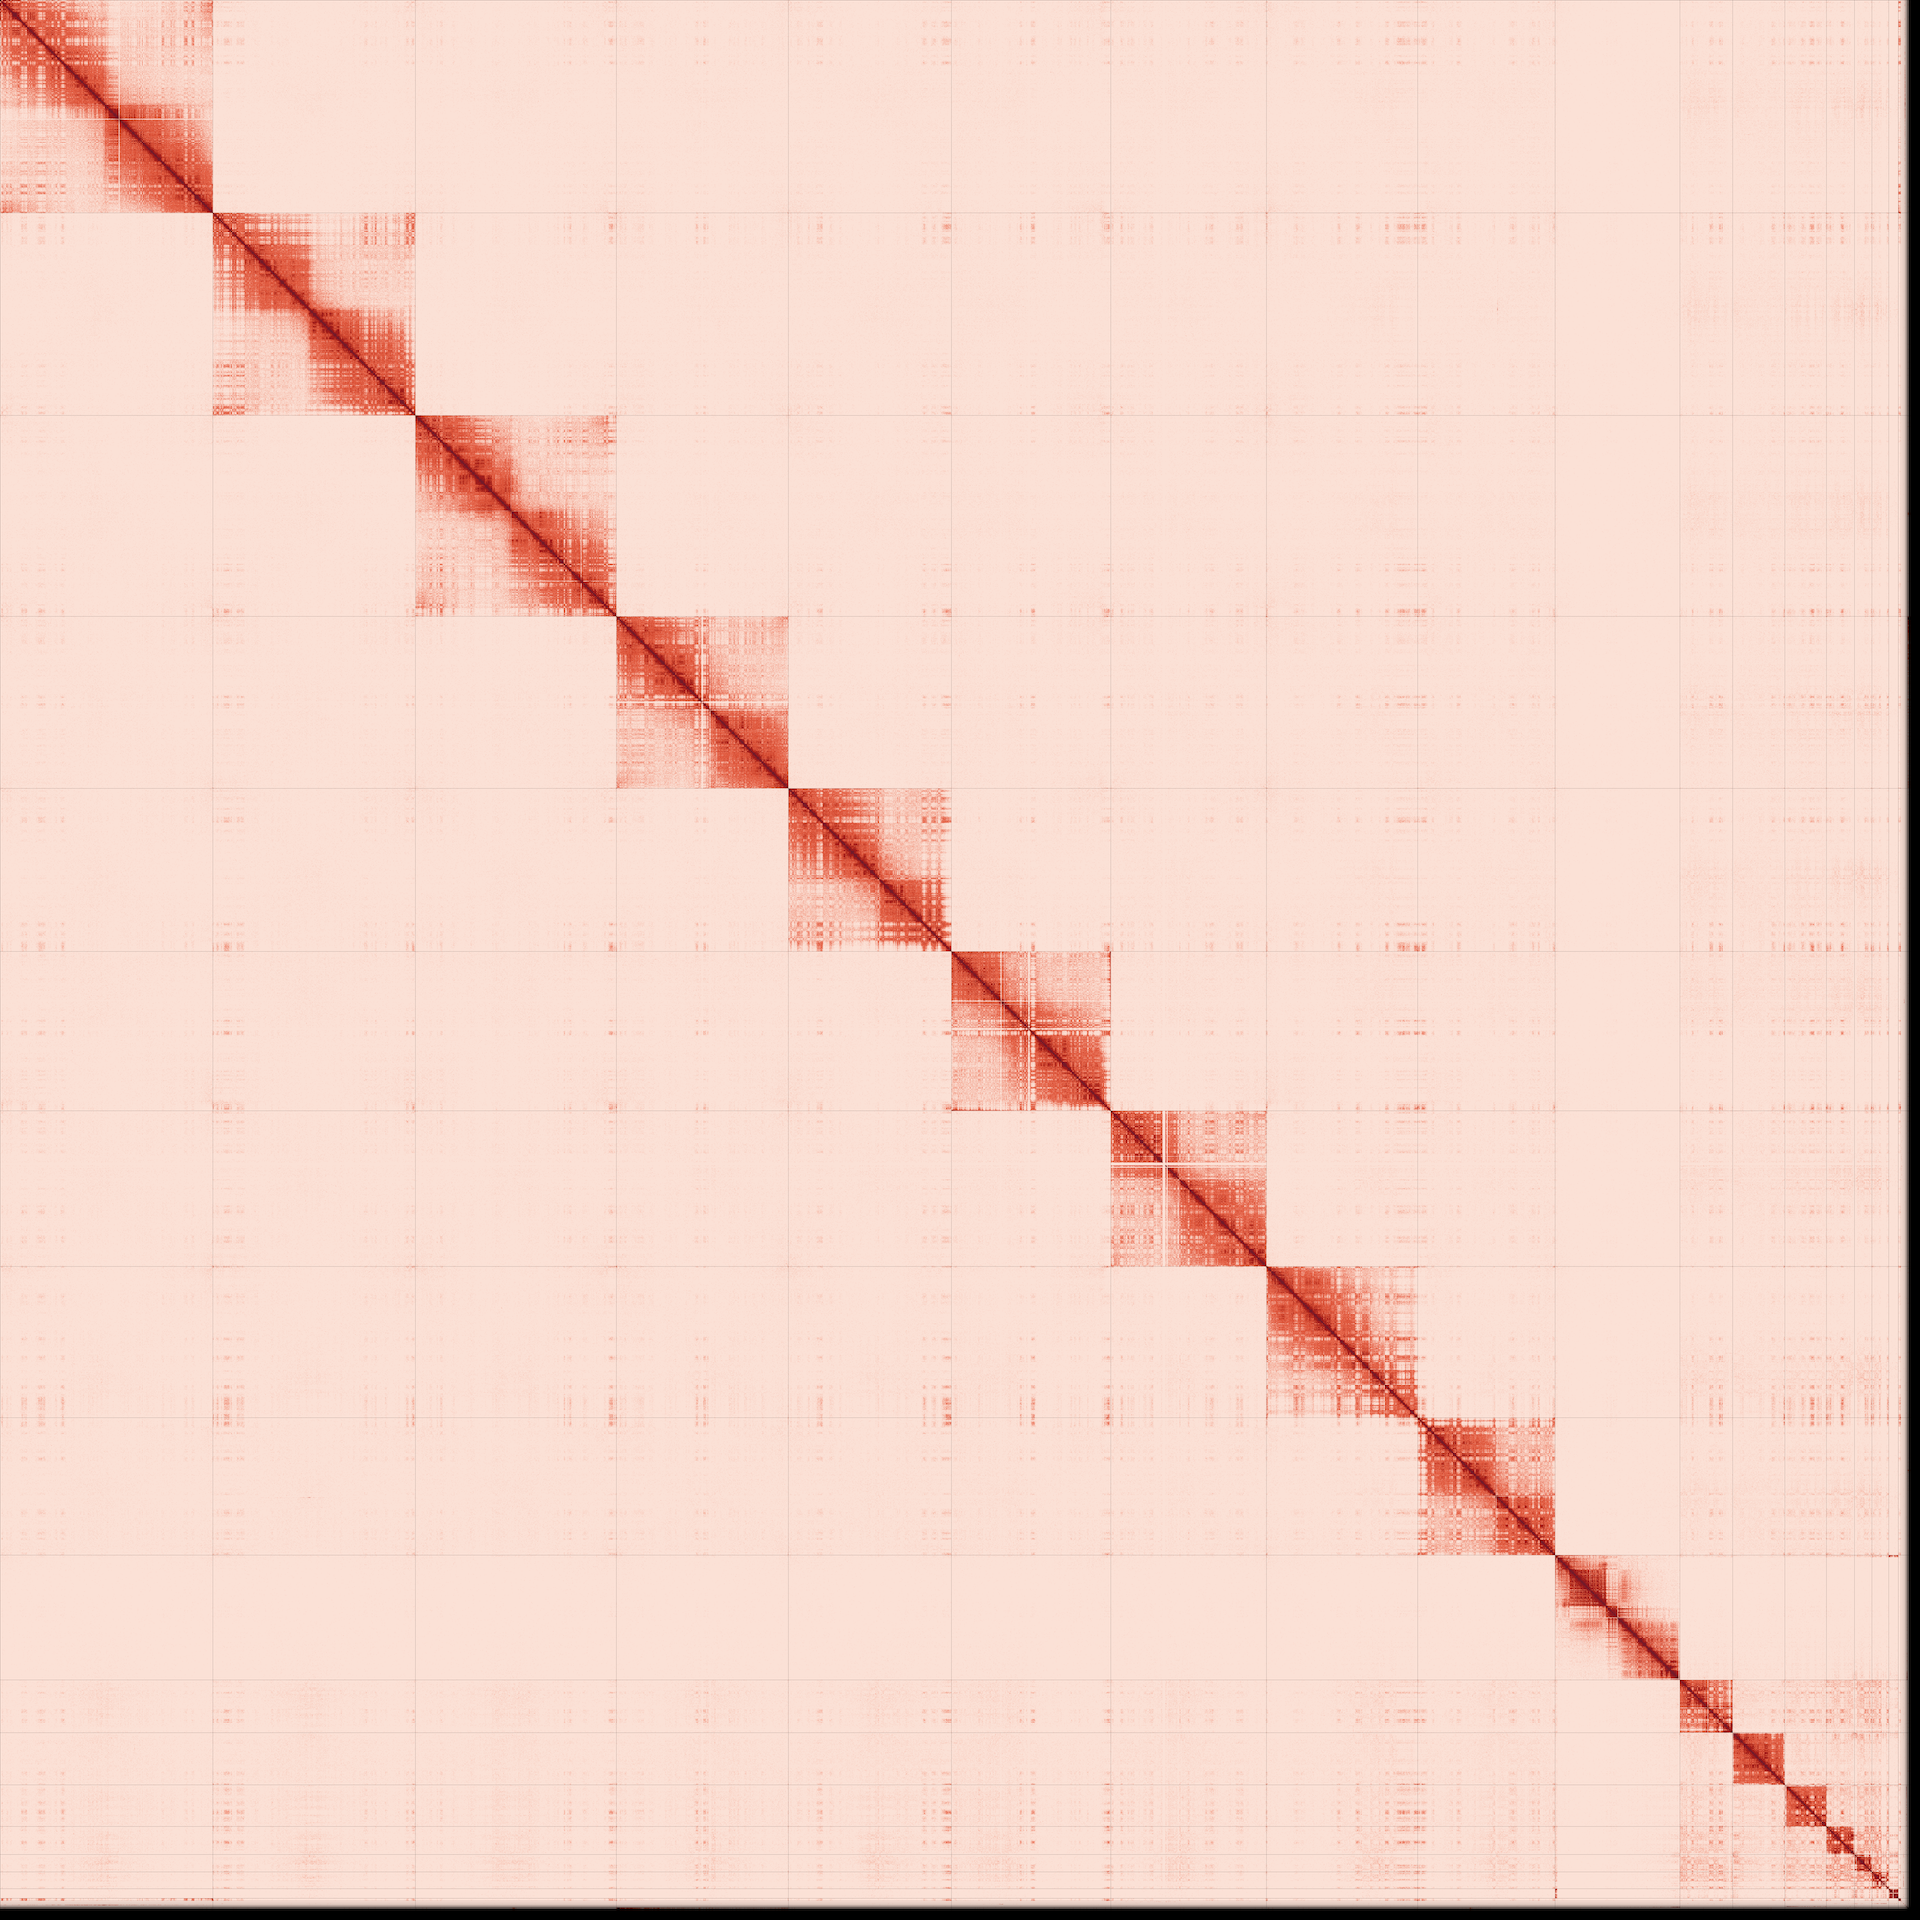
The Omni-C contact map for genome assemblies Haplotype 1 and D) Haplotype 2. Contact maps translate the proximity of sequenced regions in 3D space to linear order of sequences. Scaffolds are separated by vertical and horizontal lines.
Authors
Samantha L R Capel, Natalie M Hamilton, Devaughn Fraser, Merly Escalona, Oanh Nguyen, Samuel Sacco, Ruta Sahasrabudhe, William Seligmann, Juan M Vazquez, Peter H Sudmant, Michael L Morrison, Robert K Wayne, Michael R Buchalski


