Perognathus longimembris (Little Pocket Mouse)
Visual overview of genome assembly metrics

The k-mer spectrum of the adapter-trimmed HiFi data. The observed bimodal distribution (peaks at coverage of 16× and 28×) is expected for a diploid genome. The GenomeScope2.0 statistics are: uniq 67.8%, ab 0.001%, kcov 15.3%, err 0.214%, dup 3.83.
Snail plot of quality metrics. The circumference represents the length of the assembly: scaffolds are drawn clockwise in order of size, and the red line indicates the longest. The middle arcs represent N50 (dark orange) and N90 (light orange).

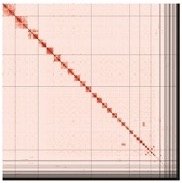
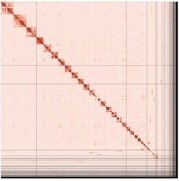
PretextSnapshot Omni-C contact maps of the primary and alternate assemblies. Every cell represents data supporting linkage between genomic regions found in proximity in 3D space
Authors
Krzysztof M Kozak, Merly Escalona, Noravit Chumchim, Colin Fairbairn, Mohan P A Marimuthu, Oanh Nguyen, Ruta Sahasrabudhe, William Seligmann, Chris Conroy, James L Patton, Rauri C K Bowie, Michael W Nachman